
The astute technologists/scientist is constantly watching the EEG to look for normal and abnormal patterns. Some patterns are subtler than others and need the altering of the routine sensitivity, display speed, filters and montages to enhance them.
The principles behind machine parameters are discussed in the ANSA Learning short courses Neurophysiology Recording Electrodes, Neurophysiology Amplifiers, Filters & Output. You may like to review this course before continuing.
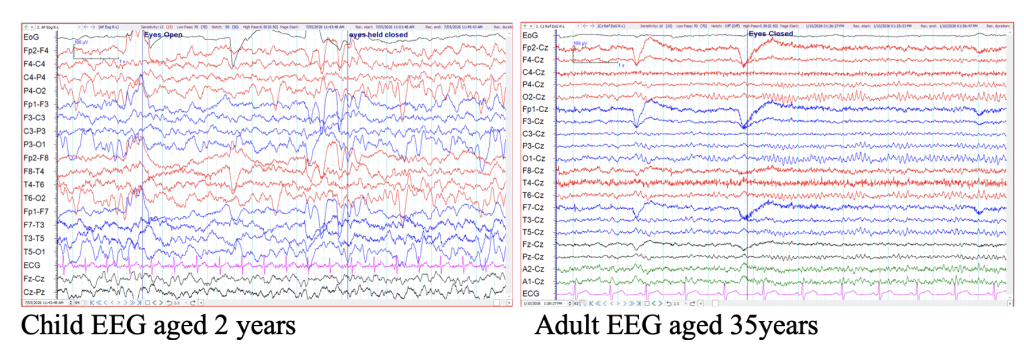
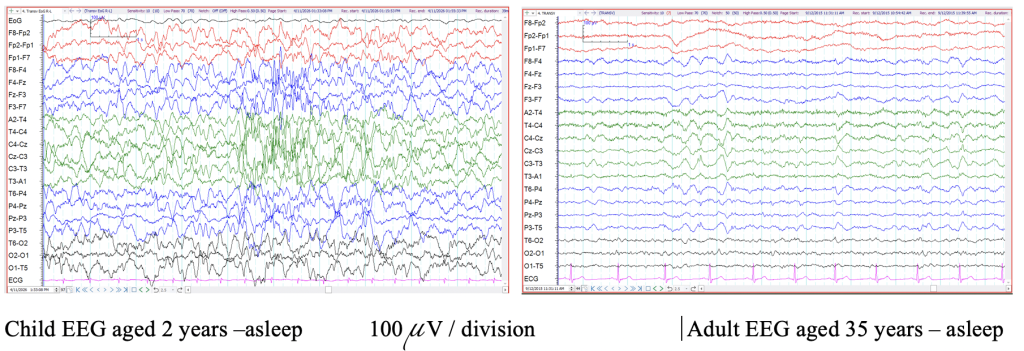
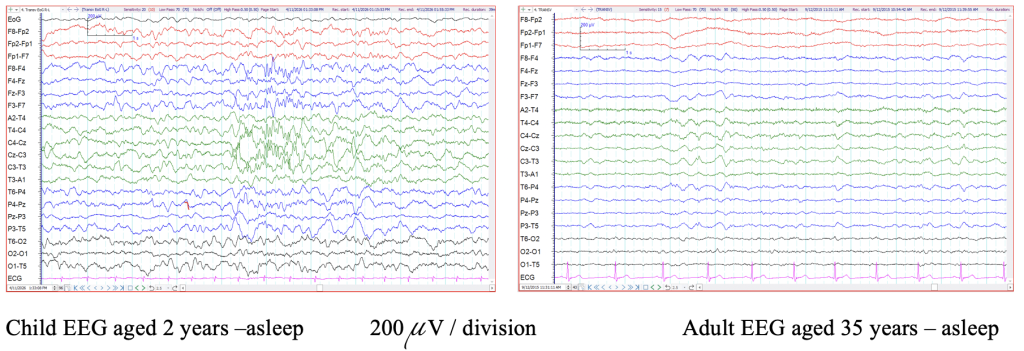
Altering the sensitivity is likely the most often needed change to the routine settings depending on the size of the waveforms recorded. The EEG of a young child is much higher in amplitude than that of an adult, so a lower sensitivity is needed when recording a paediatric EEG. Many epileptiform discharges, particularly those of the generalized form, will be very high in amplitude. A lower sensitivity is needed to be able to clearly define the activity. The anxious patient or sometimes the elderly EEG will be low in amplitude; increasing the sensitivity will enhance background activity that may be missed on the routine setting.
The example below shows the different amplitude of the waveforms in the awake EEG of a 2 year old compared to that of an adult. The sensitivities in these two samples are the same at 100uV per division.
The next example below shows the different amplitude of the waveforms in the EEG of a 2 year old compared to that of an adult during sleep. The sensitivities in these two samples are the same at 100uV per division.
The same samples are now shown at a reduced sensitivity of 200uV per division. The child’s EEG sleep architecture can now be seen much clearer. The adults EEG is suppressed at this reduced sensitivity level.
In the example below, the same epoch of EEG with a high amplitude discharge interrupting the background activity, is shown at two different display sensitivities.
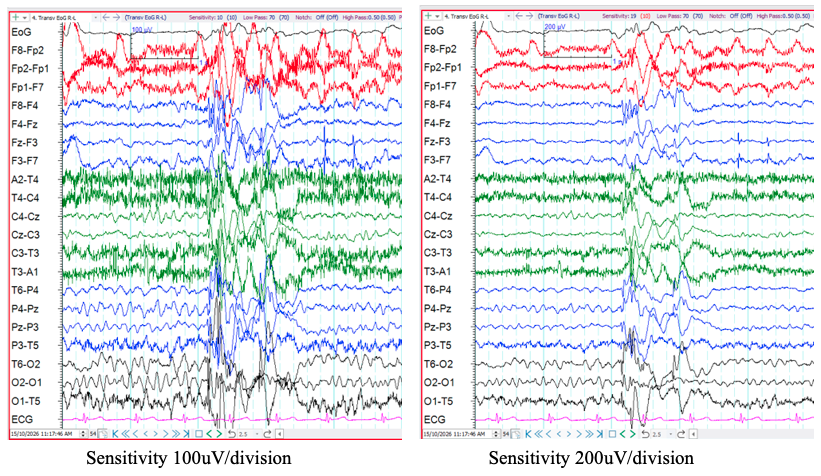
The high amplitude discharge is difficult to identify in first epoch. When the display sensitivity is decreased in the second window the discharge can be identified clearer as spike and wave activity.
Altering the filters
Altering filter settings should be done with caution but there are times when filter changes assist to enhance particular activity. To enhance the faster frequencies, we can shorten the low frequency filter to attenuate the slower frequencies. This is often helpful when there is a lot of sweat sway that could not be eliminated by other means.
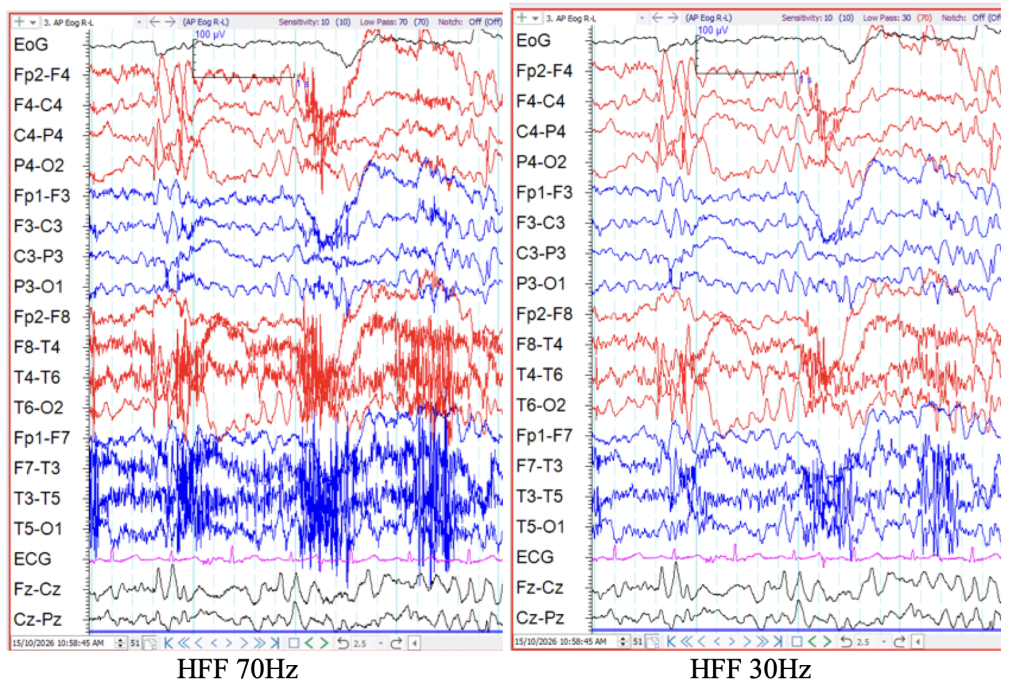
By reducing the high frequency filter setting, faster frequencies such as EMG activity can be attenuated in order to see the slower frequencies underlying clearer. The caution here is that this in hand may make EMG activity appear like spike or sharp wave EEG discharges.
In the example below, the same epoch of EEG with a high amplitude EMG activity in the temporal regions marring the background activity, is shown at two different display high frequency (low pass) filter settings.
Altering the time display
By reducing the display speed to say 30 seconds per page, slower frequencies and periodic complexes are better seen while faster frequencies become difficult to define. By increasing the display speed the faster frequencies can be examined in more detail.
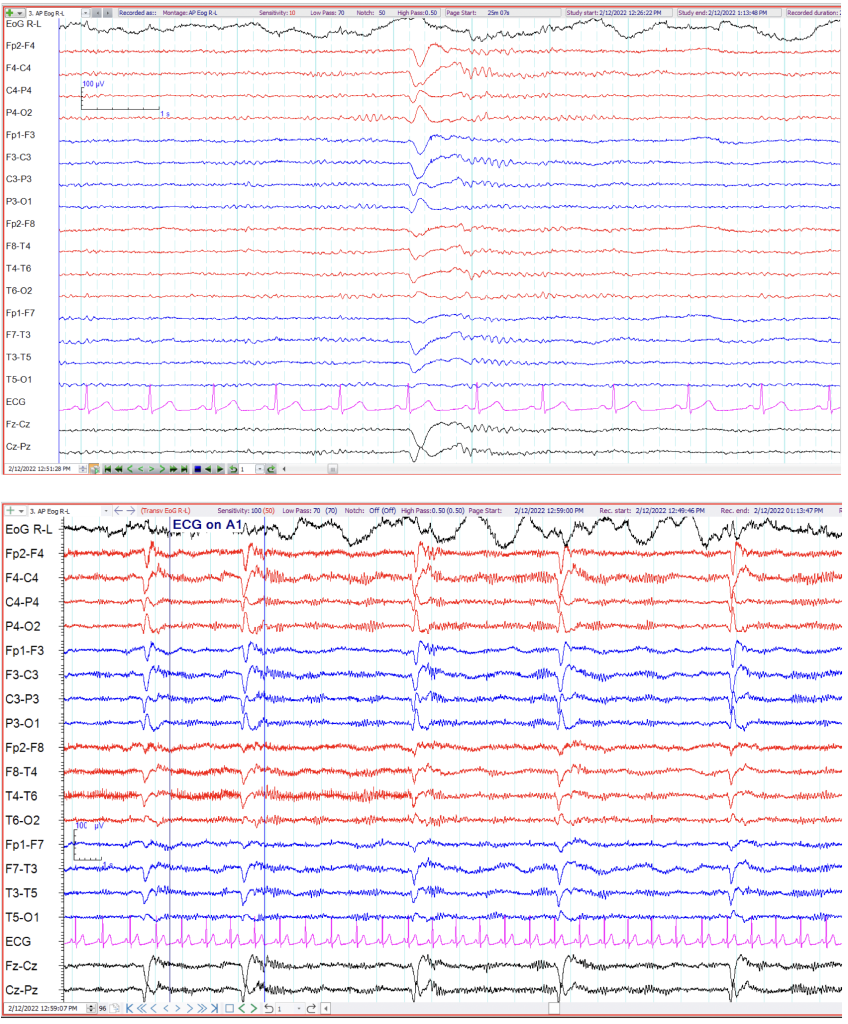
Below is an example of a generalised slow wave discharge appearing once in a 10 second epoch. The scientist/technologist noted this patterned appeared multiple times throughout the EEG. By reducing the display speed to 30s per page the pattern can now be recognised easier as periodic and stereotypical. This pattern can represent particular diagnoses such as Subacute Sclerosing Panencephalitis (SSPE).
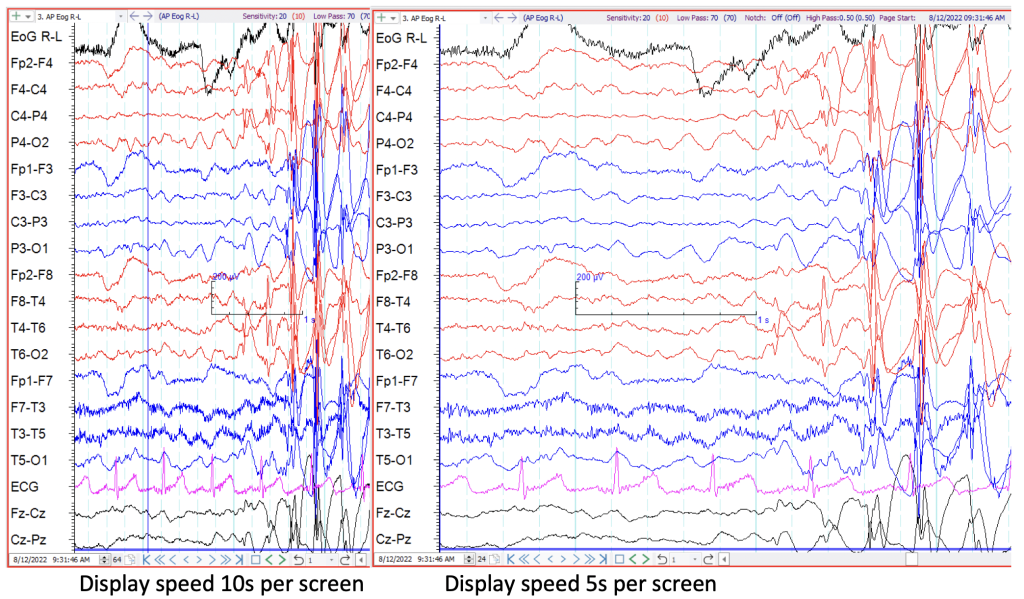
At other times it is helpful to increase the paper speed. In the example below, the same EEG sample is shown at the routine display speed and at an increased display speed respectively. The onset of the spike and wave activity is seen clearer with the faster display.
Changing montages
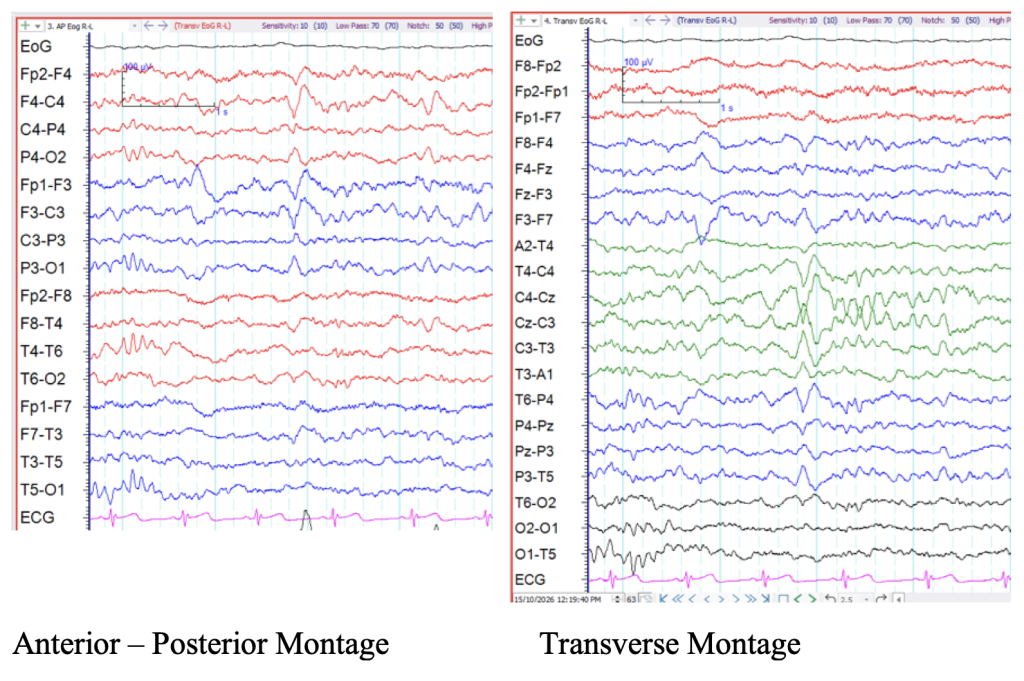
Some EEG patterns simply appear clearer in different montages. Sleep patterns can be discerned easier in the transverse montage compared to an anterior to posterior montage, particularly if the midline electrodes are not included.
In the example below, the same epoch of EEG with mixed frequencies are shown using two different montages. The first window is displayed in the anterior – posterior montage while the second window is displayed in the transverse montage.
The K complex, depicting N2 Sleep stage, is more discernable in the transverse montage.
Sometimes localizing a phenomenon is difficult in the routine bipolar montages. By changing to a common reference montage or average or source derivation, localization of the abnormality can be made clearer.
The example below shows a sharp wave in the left temporal region in the serial bipolar anterior to posterior montage. There is no clear point of phase reversal. By changing the montage to Source Derivation we can see highest amplitude sharp waves in F7, T3 and both mastoid electrodes. By changing the montage we can see more clearly that there is a sharp wave focus arising from the left anterior and mid temporal region of equal value at F7 and T3 represented by the equally high amplitude sharp waves arising from those electrodes.
Need an example here
