
During a routine EEG the scientist/technologist should analyse the EEG as it presents and have a reasonable understanding of the expected waveforms for the age and state of the patient. Unexpected patterns may require deviations from the routine procedure.
To analyse an EEG a systematic process of identifying the waveforms should be used. It is important to recognise each waveform and their place in the EEG. In this topic the different ranges of waveforms and their characteristics for different situations in the EEG recording are described.
The EEG spectrum
The waveforms that present within the EEG spectrum fall into one of four ranges: alpha, beta, theta and delta waves.
Delta > 4Hz
Theta 4- >8Hz
Alpha 8-13Hz
Beta <13Hz
These ranges help determine the state of the patient and if the EEG is normal or not depending on the frequency, amplitude, symmetry, distribution and activation.
For example, normal alpha activity is a symmetrical, posterior head region, dominant rhythm in the 8-13Hz frequency range, best seen in the alert patient with eyes closed. It can typically range in amplitude from as low as 10uV to 100uV in amplitude and attenuates with eye opening.
Morphology
Morphology is the study of the structure. In other words it describes the size, speed and occurrence of a waveform. The different EEG waveforms are described in terms of frequency, voltage, appearance, occurrence and symmetry.
Reactivity and activation
It is also important to have an understanding of how the particular activity responds to activation. The reactivity of waveforms helps determine the normalcy or even the state of a patient.
Patient state
The EEG changes significantly in different levels of consciousness. Some frequencies considered normal in the asleep adult may be abnormal if the patient is awake. The EEG in sleep has its own structure associated with specific stages of sleep. These also vary with age.
Normal variants
Although you can define many wave forms within a normal range, there are other patterns seen that do not fit into the defined characteristics but are still considered normal. There are a number patterns that do not strictly fit into the normal definitions but have been identified as benign phenomena. These patterns are considered ‘normal variants’ and are important to recognise during the EEG. By using different activation techniques some of these normal variants can be identified with some clarity
Some common normal variants are listed below:
Lambda: Positive sharp waves appearing in the occipital head region during wakefulness, especially with eyes open and visual scanning. Can be attenuated by fixing gaze. Appear sawtooth or triangular in shape.
Mu: Arc or comb shaped rhythmical waveforms of 8-12Hz, seen in the central regions during wakefulness with eyes open or closed. Attenuation occurs with sensory stimulation to the hands, motor actions or the thought of.
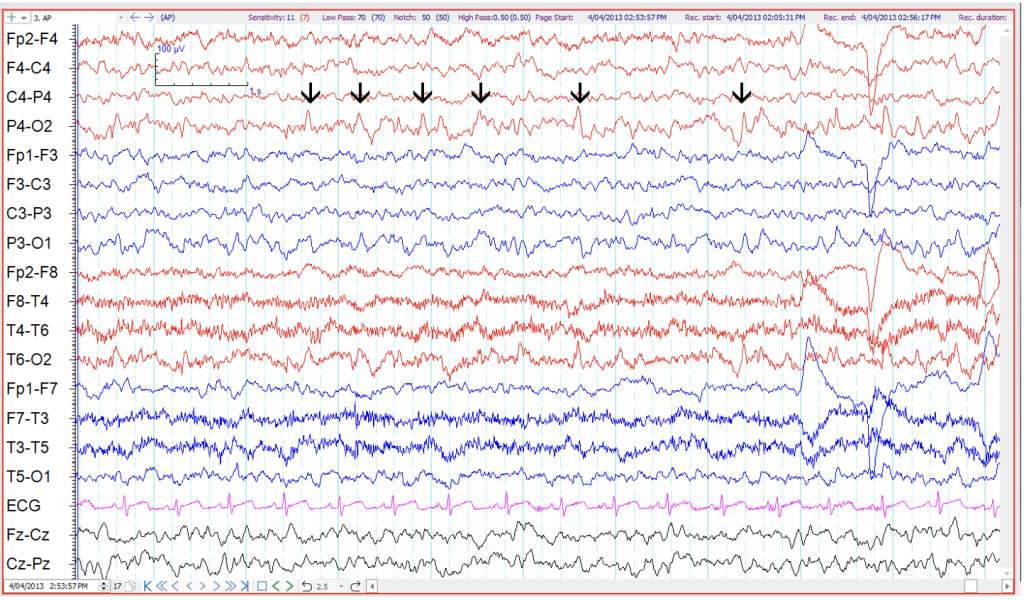
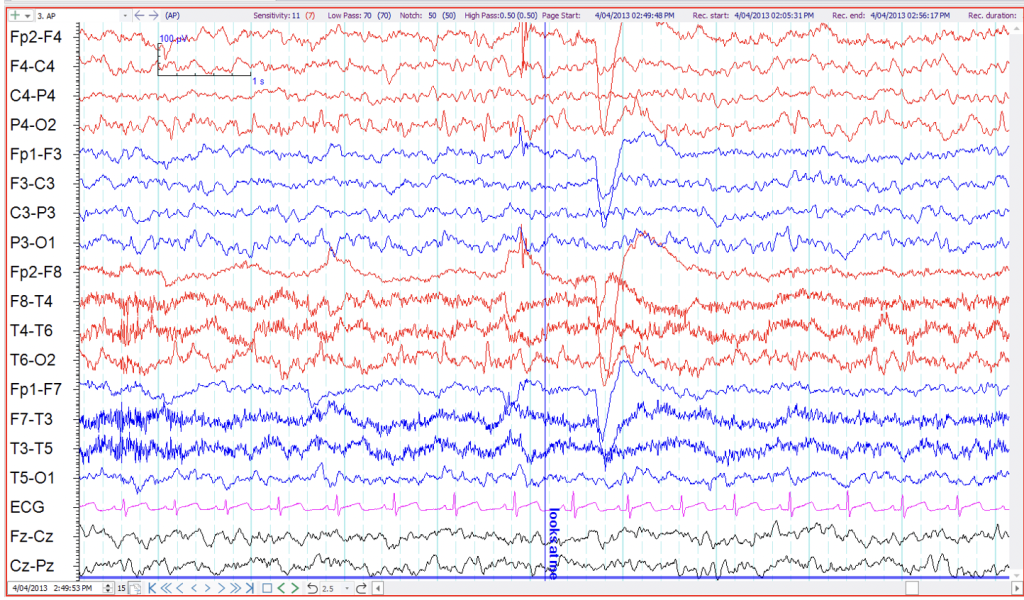
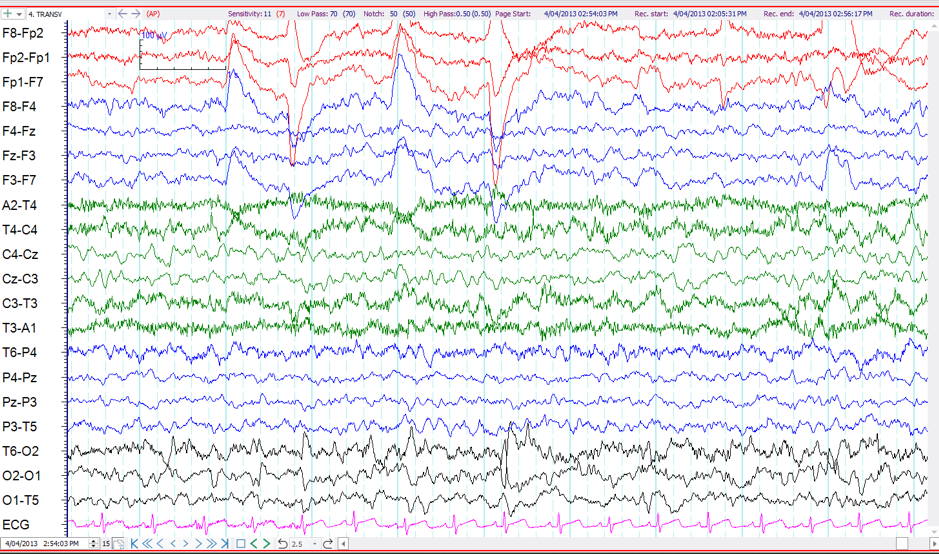
POSTS: Positive sharp waves seen in the occipital head regions during the drowsy and light sleep state. They have similar morphology to lambda waves being sawtooth or triangular in shape.
LAMBDA
The following three (3) examples of EEG demonstrate Lambda waves.
The example above is a sample of EEG taken from a 5 year old child. There are positive sharp waves in the occipital region, more obvious on the right than the left.
Another sample of EEG taken from the same child shows the occipital positive sharp waves attenuate when the child is asked to fix their gaze.
Another sample of EEG taken from the same child show the occipital positive sharp waves in the transverse montage. The positive sharp waves attenuate when the child ‘s eye movements reduce, likely fixing their gaze spontaneously.
MU Rhythm
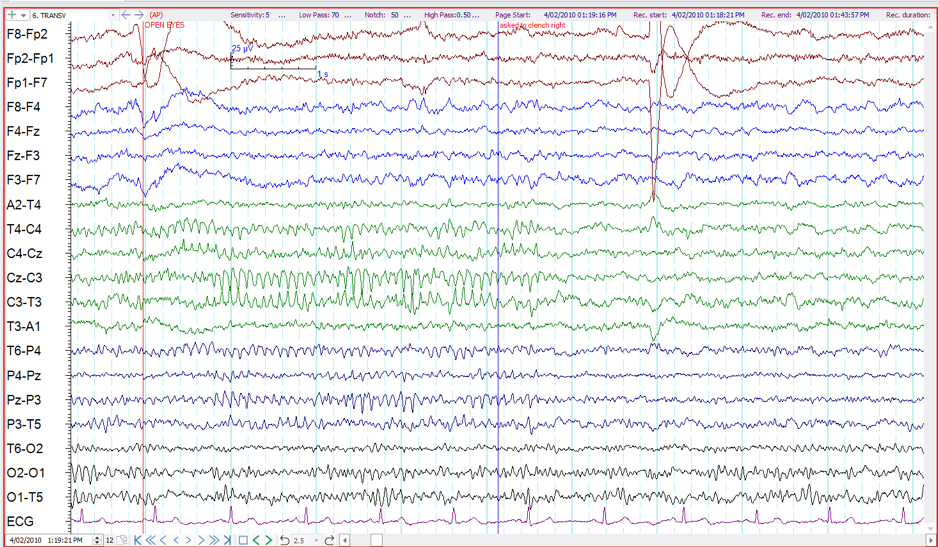
The above example is a sample of EEG showing arc shape rhythmical waveforms in left greater than right central regions. By asking the patient to clench their contralateral fist the arc shape activity attenuates, clarifying this is Mu rhythm.
POSTS – Positive Occipital Sharp Transients of Sleep
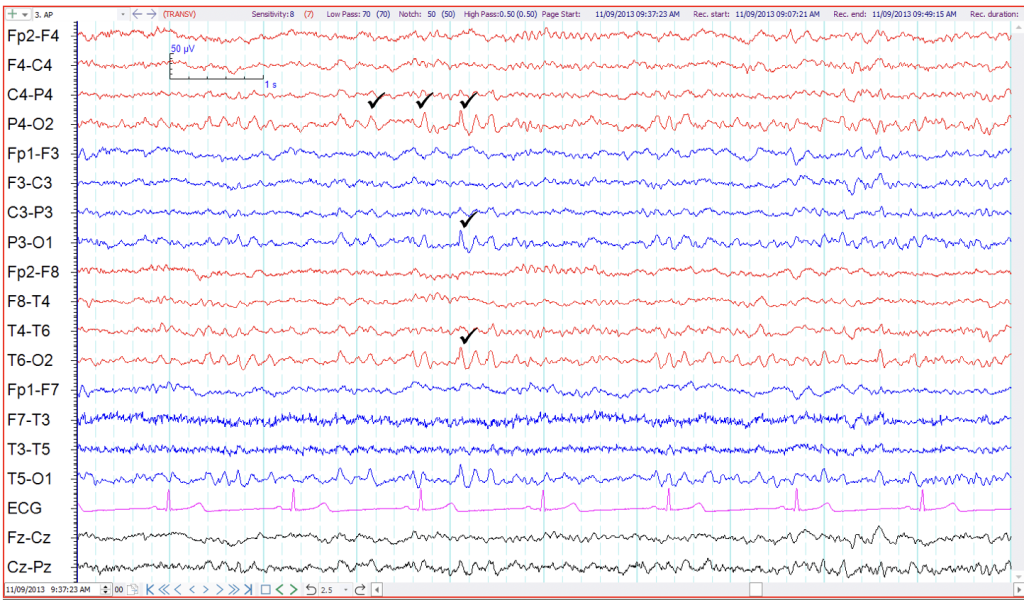
Positive sharp waves are depicted with a tick in the above EEG sample. They are saw tooth in shape and look similar to Lambda waves. They are differentiated from Lambda waves because these sharp waves are seen in sleep.
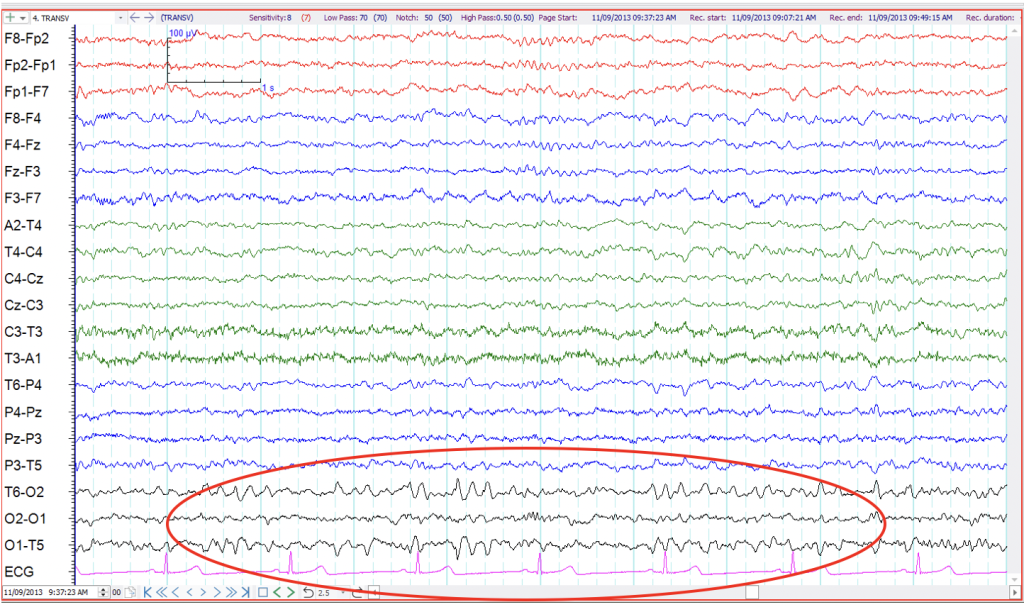
This is the same EEG sample in transverse montage. POSTS can be seen in the occipital channels.
Normal variants can often be a lengthy topic for discussion when reporting the EEG. Many texts such as R. Spehlmann’s EEG Primers or even google searches can assist with recognition of normal variants. They are often categorised into age group, head region and patient state. It is worth familiarising yourself with good references to access when needed.
More detail on interpreting and describing waveforms will be discussed in the ANSA Learning EEG Interpretation and Factual Report Writing short courses (as at Sept 2026 availability TBA).
